|
|
0.6.0
|
|
|
0.6.0
|
Thermoacoustic wave propagation in a perfect gas.
Thermoacoustic wave propagation in a perfect gas.
The generation and propagation of thermoacoustic wave is the subject of the present test case introduced by [1] and later studied by [2]. A nitrogen-filled one-dimensional cavity of length \(L=1\) mm is at the initial state \((T_0,p_0,\rho_0)=(300 K, 101325 Pa, \frac{p_0}{R T_0})\), where the gas is considered to be a perfect gas. The viscosity and conductivity of the fluid are temperature dependent polynomial function. The viscosity and conductivity law has been set by a quartic temperature law polynomial. Material properties \(x\) is thus computed as
\[ x(T) =\sum_{i=0}^{3} {a_x}_i T^i \, , \]
with \( {a_x}_i \) the \( i^{\mathrm{th}}\) constant parameter in \([x]\mathrm{K}^{-i}\) with \([x]\) the unit of \(x\). We set for viscosity and conductivity respectively
\[ ({a_\mu}_0,{a_\mu}_1,{a_\mu}_2,{a_\mu}_3) = ( 1.24\times 10^{-06}, 6.32\times 10^{-08}, -4.65\times 10^{-11}, 2.01\times 10^{-14}) \, ,\\ ({a_\lambda}_0,{a_\lambda}_1,{a_\lambda}_2,{a_\lambda}_3) = (-7.26\times 10^{-04}, 9.76\times 10^{-05}, -7.18\times 10^{-08}, 3.10\times 10^{-11}) \, . \]
The dimensionless parameters are respectively \(\mathrm{Ma}_0 = 6.0\times 10^{-2}\) (computed from velocity max peak at \(t=0.25 t_0\) and the initial speed of sound \(c_0=\sqrt{\gamma R T_0}\)) and \(\mathrm{Pr}_0 = 0.75\).
For velocity boundary conditions, left and right boundaries have no-slip conditions while top and bottom boundaries have slip conditions. For temperature boundary conditions, top and bottom have homogeneous Neumann conditions, right and left have respectively Dirichlet condition with \(T_R=T_0\) and \(T_L(t>0)=2T_0\).
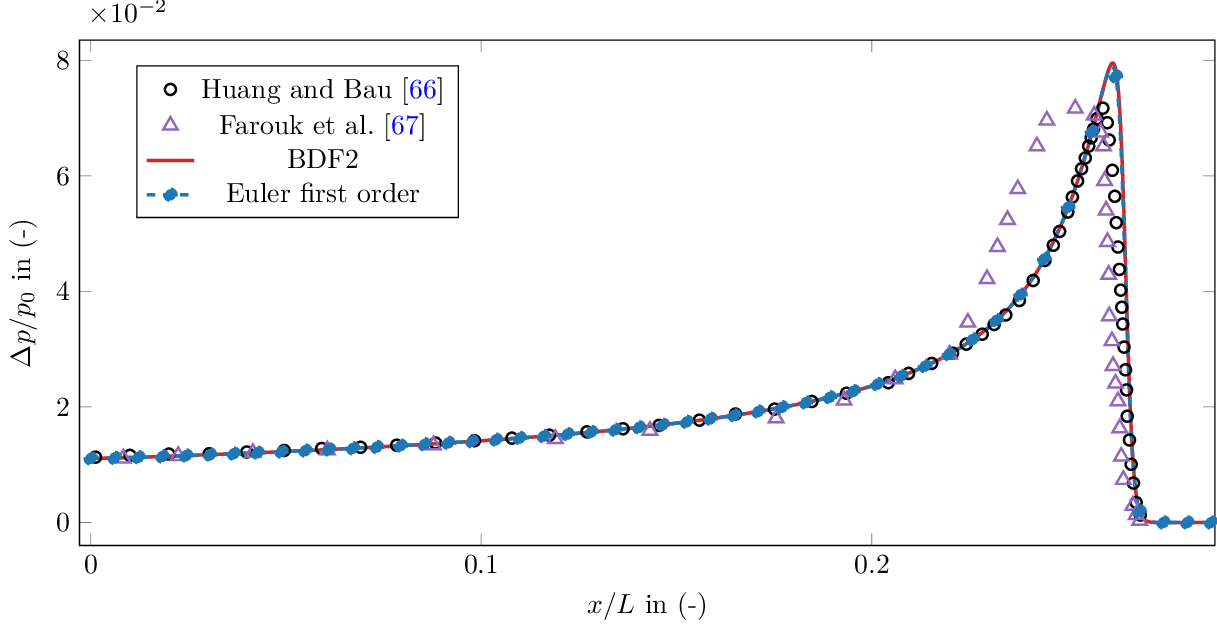
The validation of this test case is carried out by the comparison of our pressure wave profile at time \(t=0.25 t_0=7.08\times 10^{-07}\) s against reported data from simulations of the original paper [1] and from [2].
Main parameters to run this test case are:
Figure 1 presents the thermoacoustic wave shape within the cavity at \(t=0.25 t_0\) by plotting the dimensionless relative pressure along space for our simulation and literature data. This flow is characterized by the propagation of a pressure wave with a sharp front and an increasing peak width over time [1,2]. Because of the strong heating on the left of the cavity and the ideal gas hypothesis, the wave speed is variable and its correct prediction is mandatory. An inconsistency between the two references about the wavefront and the speed of the wave can be seen in Fig. 1. The proposed solution (mesh size \(32768\times8\) and CFL=0.1), resulting from a spatial and temporal comparative study, can be seen as a reference solution. It is possible to validate the propagation speed of the [1] wave by comparison with our data. Note that for the two previous solutions [1,2], the numerical diffusion explains the attenuated wave observed. The present benchmark permits to validate our method to simulate thermoacoustic wave propagation. In the next test case, we investigate the same phenomenon very close to the liquid-vapor critical point with a very low amplitude and sharp thermoacoustic wave propagation.
[1] Y. Huang and H. H. Bau. Thermoacoustic waves in a confined medium. International Journal of Heat and Mass Transfer, 40(2):407419, 1997. doi: 10.1016/0017-9310(96)00068-3.
[2] B. Farouk, E. S. Oran, and T. Fusegi. Numerical study of thermoacoustic waves in an enclosure. Physics of Fluids, 12(5):10521061, 2000. doi: 10.1063/1.870360.