|
|
0.6.0
|
|
|
0.6.0
|
Thermoacoustic wave propagation in supercritical CO2.
Thermoacoustic wave propagation in supercritical CO2.
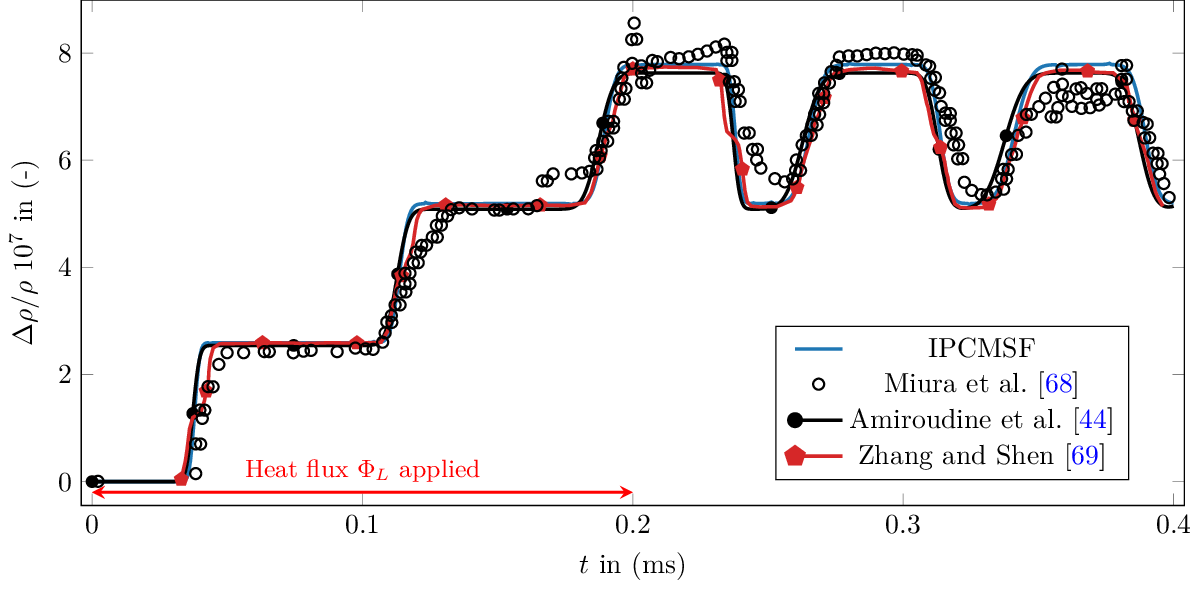
[1] firstly study experimentally supercritical carbon dioxide acoustic wave propagation using a very sensitive interferometer to capture the piston effect within a cavity of length \(L=1.08\) cm. The reproduction of [1] experimental data has been the cornerstone for validation of a CFD code with applications in supercritical fluid dynamics [2,3]. On the critical isochore and very close to the critical point ( \(T_c=304.13\) K, \(\rho_c=467.6\) kg/m3, \(p_c=73.77\) bar), the authors reported the normalized variation of density \(\frac{(\rho - \rho_0)}{\rho_0}\times 10^7\) along a period of time \(t_f=0.4\) ms when the left cavity is heated by a constant heat flux \(\Phi_L\) during \(0.2\) ms. After this period, adiabatic condition is imposed to the left wall. The reproduction of [1] experimental data has been the cornerstone for validation of a CFD code with applications in supercritical fluid dynamics [2,3]
A simulation employing identical initial and boundary conditions as those observed in the experimental setup has been conducted within a one-dimensional domain. For the temperature boundary, we impose on the left wall a constant heat flux \(\Phi_L=1.83\) kW/m2 during the first \(0.2\) ms and adiabatic condition to the right wall and left wall after \(t>0.2\) ms. For the velocity boundary, we impose slip condition to all boundaries. The NIST refprop library has been used as EoS to compute the density and all the thermophysical properties of the fluid.
According to the experiment and the simulations (see Fig. 1, 2), the wave propagates continuously between the left and right walls. This leads to an increase in bulk temperature and, consequently, an increase in density. The present test case is highly challenging given the very low variations in density (approximately \(1 \times 10^-7\)) and the sharp shape of the travelling wave.
Main parameters to run this test case are:
Figure 1 presents the normalized density variation at the cell centre as a function of time of the \(T_0-T_c=150\) mK experiment of [1]. The results with first-order Euler backward are found to be in excellent agreement with experimental results, as well as other numerical solutions, validating the proposed method for flows very close to the critical point. Let us note that we simulated this test case with BDF2 temporal scheme but because of the dispersivity of the scheme and the sharp shape of the wave, the travelling is reconstructed at CFL=1 with oscillations of the solution.
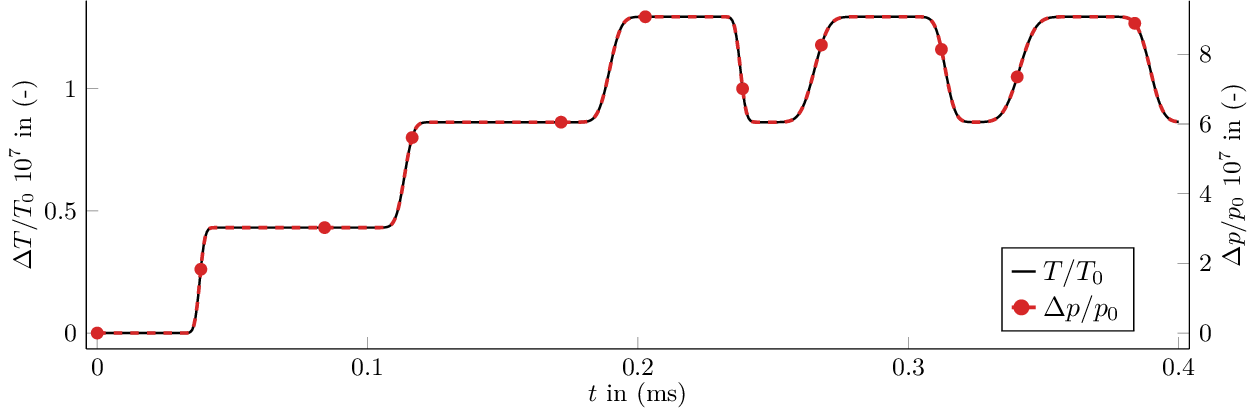
In addition of density variations and for the sake of reproducibility, Figure 2 shows the normalized variations of temperature and pressure at the centre of the cell. As we compute density solely from the NIST refprop database and given our excellent result on the density wave propagation, it means excellent pressure and temperature resolutions.
[1] Y. Miura, S. Yoshihara, M. Ohnishi, K. Honda, M. Matsumoto, J. Kawai, M. Ishikawa, H. Kobayashi, and A. Onuki. High-speed observation of the piston effect near the gas-liquid critical point. Physical Review E, 74(1), 2006. doi: 10.1103/physreve.74.010101.
[2] S. Amiroudine, J.-P. Caltagirone, and A. Erriguible. A lagrangianeulerian compressible model for the trans-critical path of near-critical fluids. International Journal of Multiphase Flow, 59:15–23, 2014. doi: doi.org/10.1016/j.ijmultiphaseflow.2013.10.008.
[3] P. Zhang and B. Shen. Thermoacoustic wave propagation and reflection near the liquid-gas critical point. Physical Review E, 79(6), 2009. doi: 10.1103/physreve.79.060103.